ENVIRONMENTAL CHANGE AND MANAGEMENT
  • Environments
    • Environmental Change
    • Environmental Management
  • Investigative Study 1 - Coral Reefs
    • Corals - Glossary
    • Corals - Biophysical processes >
      • Corals - Coral health and diversity
    • Corals - Causes of change >
      • Corals - Bleaching
      • Corals - Bleaching Research lesson
      • Corals - Investigating Change
      • Coral - Investigating change with GIS
      • Corals - Adani infographic
      • Coral - Using Within
      • Corals - Lizard Island >
        • Corals - Lizard Island 2012
        • Corals - Lizard Island 2016
    • Corals - Management >
      • Adani Debate
      • Corals - Evaluating Management
      • Corals - Video Conference
      • Corals - Management activities
      • Corals - Management - Twitter
  • Investigative Study 2 - Tundra
    • Tundra - Glossary
    • Tundra - biophysical processes >
      • McDonald and Heard Islands - Biophysical processes
      • Churchill - biophysical processes
      • Skills: climate graphs
      • Maps: Heard Island
    • Tundra - Causes of change >
      • Heard and McDonald Islands - Causes of Change
      • Churchill - Causes of Change
      • Tundra - Cause and effect
      • Tundra - climate change infographic
      • Tundra - virtual fieldwork
      • Tundra - maps and photos
      • Tundra - Using Twitter
      • Tundra Connections
    • Tundra - Management >
      • Heard and McDonald Islands - Management
      • Churchill - Management
      • Evaluating Management Strategies
      • Tundra - Writing task
      • Tundra - Radio collar tracking
    • Tundra Revision
  • HSIE Teachers Home

Skills - Climate graphs

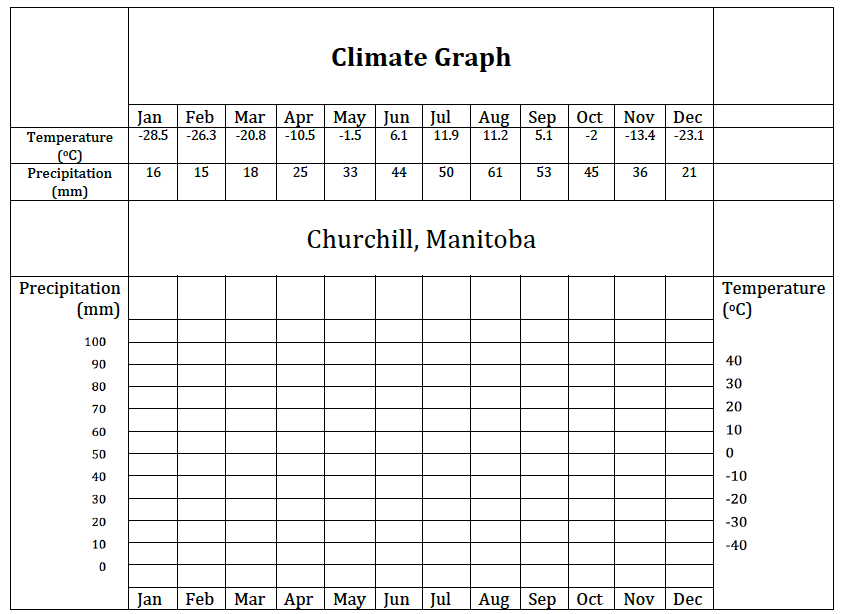
A climate graph is a graph which shows the annual rainfall and temperature at a particular location. The rainfall (or precipitation) is indicated by a blue bar for each month.

The temperature is indicated by a line on the graph showing the temperature for each month. This line is red. 

The months of the year are on the bottom axis of the graph. Temperature is usually on the right axis and rainfall is usually on the left axis.
​
Download the handout and complete the climate graph for Churchill, Manitoba

Picture
climate_graph_-_churchill.pdf
File Size: 67 kb
File Type: pdf
Download File

Powered by Create your own unique website with customizable templates.
  • Environments
    • Environmental Change
    • Environmental Management
  • Investigative Study 1 - Coral Reefs
    • Corals - Glossary
    • Corals - Biophysical processes >
      • Corals - Coral health and diversity
    • Corals - Causes of change >
      • Corals - Bleaching
      • Corals - Bleaching Research lesson
      • Corals - Investigating Change
      • Coral - Investigating change with GIS
      • Corals - Adani infographic
      • Coral - Using Within
      • Corals - Lizard Island >
        • Corals - Lizard Island 2012
        • Corals - Lizard Island 2016
    • Corals - Management >
      • Adani Debate
      • Corals - Evaluating Management
      • Corals - Video Conference
      • Corals - Management activities
      • Corals - Management - Twitter
  • Investigative Study 2 - Tundra
    • Tundra - Glossary
    • Tundra - biophysical processes >
      • McDonald and Heard Islands - Biophysical processes
      • Churchill - biophysical processes
      • Skills: climate graphs
      • Maps: Heard Island
    • Tundra - Causes of change >
      • Heard and McDonald Islands - Causes of Change
      • Churchill - Causes of Change
      • Tundra - Cause and effect
      • Tundra - climate change infographic
      • Tundra - virtual fieldwork
      • Tundra - maps and photos
      • Tundra - Using Twitter
      • Tundra Connections
    • Tundra - Management >
      • Heard and McDonald Islands - Management
      • Churchill - Management
      • Evaluating Management Strategies
      • Tundra - Writing task
      • Tundra - Radio collar tracking
    • Tundra Revision
  • HSIE Teachers Home